Creating a new UEM Persistence setting for User DSNs

  1. Launch User Environment Manager – Management Console


  1. Right-click Windows Settings and select Create Config File…


  1. Select Create a custom config file, and click Next


  1. Enter a name, for example User DSN, and click Next


  1. Add the text shown below.


  1. Navigate away from the node, and click Yes to save


  1. To validate:
  • login as a user
  • Create a user DSN
  • Log off
  1. Look in the user’s UEM profile archive folder to ensure it contains UserDSN.zip. A similar path is shown below:


Basic Deployment of NSX for Horizon

Solution Overview

This process includes an outline of the steps needed to deploy a micro-segmentation policy for VDI desktops using NSX for Horizon. The goal is to create a few groups of rules. These rule groups include the following:

  • ID-based Rules – Identity-based rules are used to allow access to applications. Multiple ID-based rules can be used to allow specific AD groups access to specific applications. These rules include access to system that would not be required when a user is not logged in.
  • Computer Rules – This rule set allows access from VDI desktops to talk to computer-level services, like domain controllers, KMS, Connection Servers, and DHCP. These services would need to be available to the system at startup.
  • Block Rules – These rules will block East-West traffic among the desktops to ensure desktops cannot communicate with one another; block all remaining traffic out of the desktop (and into the desktop if desired).
  • Client Access – This rule allows client endpoints the ability to access the desktop using display protocols and virtual channels for USB Redirection and Client Drive Redirection.

This solution assumes a kiosk setup. The desktops are configured to use local mandatory profiles. The solution does not include user profile persistence, nor does it leverage App Volumes.

Preliminary Steps

This preliminary section is required in order to ensure all components function properly and the components for all of the rules are created and available when it comes time to create the rules.

Deployment Assumptions

  • NSX Manager deployed and registered
  • VIBs deployed to hosts
  • Licenses allocated
  • Log Insight deployed and configured
  • Appropriate permissions assigned
  • vDS configured for all hosts

Create Exclusions

  • Create exclusion for vCenter

Prepare for ID Rules

  • Connect to domain – will need to create a specific service account
    • The domain account must have AD read permission for all objects in the domain tree. The event log reader account must have read permissions for security event logs – KB2122706
  • Create VDI User AD Group
  • Create Super User Group
  • Validate VMware Tools Versions
    • 10.0.8
    • KB 2139740
  • Deploy Guest Introspection
    • 1x IP address per host
    • Create IP Pool

Create Objects

Security Groups

  • Contains VDI Desktops
    • based on VM name or OS-type
  • Contains AD group
    • user accounts that will be used to login to desktops
  • Contains AD super users group (Domain Admins)

IP Sets

  • Network Address ranges that should be able to access VDI desktops
  • Proxy Server
  • DHCP Servers
  • DNS/Domain Controllers
  • Connection Server
  • KMS Server

Service Objects

  • Blast Extreme – 22443 TCP
  • Blast Extreme UDP – 22443 UDP
  • KMS – 1688
  • MMR – 9457
  • VMware-View6.x-JMS – 4002

Service Group Objects

  • Client Access
    • VMware-View-PCoIP
    • Horizon 6 PCoIP UDP traffic from View Agent to Client
    • VMware-View5.x-PCoIP-UDP
    • Blast Extreme
    • Blast Extreme UDP
    • Horizon 6 USB Access to desktops
    • MMR
    • RDP

Create Firewall Rules Desktops

This section describes how to use the newly created objects as well as pre-existing objects to create the various rule groups.

Group – Block E/W

Source

Service

Destination

Purpose

VDI Security Group

Any

VDI Security Group

Block E/W Traffic

Group – Grant Client Access

Source

Service

Destination

Purpose

Client Access IP Set

-Client Access (Group)

VDI Security Group

PCoIP

Blast Extreme

USB Redirection

MMR/CDR

RDP

Group – Permit User Applications

Source

Service

Destination

Purpose

Desktop User Secuirty Group

-HTTP

-HTPS

Proxy Server IP Set

Internet Access/Proxy

Super User Security Group

Any

Any

Super User – Unrestricted

Group – Permit Computer Applications

Source

Service

Destination

Purpose

VDI Security Group

-DHCP Server

-DHCP Client

DHCP Server IP Set

DHCP Relay

VDI Security Group

-Win 2008 – RPC, DCOM, EPM, DRSUAPI, NetLogonR, SamR, FRS

– Microsoft Active Directory (Group)

Domain Controller IP Set

Domain Authentication

VDI Security Group

-MKS

KMS Server IP Set

KMS

VDI Security Group

– VMware-View6.x-JMS

– VMware-View5.x-JMS

Connection Server IP Set

Connection Server Management of Desktop Agents

Connection Server IP Set

– Blast Extreme

VDI Security Group

HTML 5 Access

Block All – All traffic from VMs

Source

Service

Destination

Purpose

VDI Security Group

Any

Any

Block All other traffic

OR

Block All – All traffic to AND from VMs

Source

Service

Destination

Apply To

Purpose

Any

Any

Any

VDI Security Group

Block All other traffic

Wrap Up & Validation

  • Enable Logging on all rules
  • Enable flow monitoring – Validate

Validate

  • Log in to VDI desktop via HTML
  • Log in to VDI desktop via Client using PCoIP
  • Log in to VDI desktop via Client using Blast
  • Verify USB Redirection
  • Verify Connection Server reports desktops are reachable
  • Verify Internet is reachable
  • Verify other desktops are not reachable within a VDI desktop

Finding the right Lenovo Firmware for vSAN

With any new vSAN deployment, it is critical to ensure the drivers and firmware levels are in compliance with the VMware Compatibility Guide (VCG). Get to the VCG by following the steps below.

  1. Go to the VMware Compatibility Guide here
  2. Go to the vSAN section of the Compatibility Guide here
  3. Select Build Your Own based on Certified Components near the bottom

You’ll see the vSAN component selector. Even if you purchase a vSAN ready node, it is a good idea to reference this page to ensure that the firmware and driver that comes preinstalled on the system are what is supported by vSAN.

Our focus today is Lenovo firmware, specifically the ServeRAID 5210 SAS/SATA controller. Select I/O Controller in the Search For field and Lenovo in the Brand Name field, and enter 5210 in the click Update and View Results.

In this case, two 5210’s are listed. On the console of the host, run the following command (assuming your ServeRAID controller is vmhba0) to view the Vendor ID, Device ID, SubSystem Vendor ID, and Subsystem ID of the device.

In this case, the following value was returned, showing that a ServeRAID 5210 was installed and NOT a ServeRAID 5210e.

Upon clicking the link for the model, the below information is presented. This is where the fun begins.

The vSAN VCG shows that version 4.620.00-7178 should be installed. Upon checking the IMM of the Lenovo server, it was determined that the controller had a firmware version of 24.16.0-0104. Needless to say, the version installed does not line up with the version listed in the VCG.

Upon going to the Lenovo support site, and checking for controller firmware for the 5210, which was installed in a Lenovo 3650 M5 type 8871, the versions continued to be mismatched.

So, here’s the trick. Open up the Change History file. The change history file contains the mapping between the Lenovo firmware package name, and the MegaRAID firmware version. Below is a snipped of the change log. It seems that the MegaRAID firmware version is what is listed in the VCG. In this case, firmware version 4.620.00-7178 corresponds with Lenovo firmware package 24.12.0-0033.

Using VSAN Performance Graphs

This document details the use of the graphs provided by the vSAN performance service. The vSAN performance service provides end-to-end visibility into vSAN performance. With metrics accessible by the vSphere Web Client, it further enhances an administrators view into the vSAN storage environment.

Front-end vs Back-end

Many of the performance graphs refer to front-end and back-end. Virtual machines are considered front-end – where the application on the virtual machine reads and writes to disk, generating say 100 IOPS. Backend traffic refers to the underlying objects – where the same VM, configuring in a RAID-1 configuration, would generate that same 100 IOPS across both replicas, thus totaling 200 back-end IOPS.

Cluster Level

These views provide insight into the front-end and back-end performance and utilization at the cluster level.

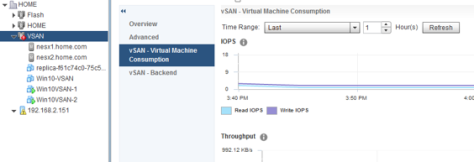
vSAN – Virtual Machine consumption

This set of graphs provides a front-end view of all virtual machines in the cluster.

Graphs

  • IOPS – IOPS consumed by all vSAN client in the cluster, including virtual machines & stats objects
  • Throughput – Throughput of all vSAN client in the cluster, including virtual machines & stats objects
  • Latency – Average latency of IOs generated by all vSAN clients in the cluster, including virtual machines & stats objects
  • Congestion – Congestion of IOs generated by all vSAN clients in the cluster including virtual machines & stats objects
  • Outstanding IO – Outstanding IO from all vSAN clients in the cluster, including virtual machines & stats objects
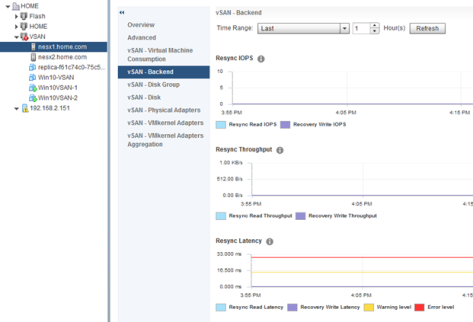
vSAN – Backend

This section provides a glimpse into the backend of the vSAN cluster.

Graphs

  • IOPS – vSAN Cluster Backend IOPS
  • Throughput – vSAN Cluster Backend Throughput
  • Latency – vSAN Cluster Backend Latency
  • Congestion – vSAN Cluster Backend Congestion
  • Outstanding IO – vSAN Cluster Backend Outstanding IO

Host Level

Similar to the Cluster view, the host view provides insight into the front-end and back-end performance and utilization, except at the host level. Given that the ESXi host is the foundation building block of a vSAN cluster, these views provide insight into the indidual disk groups and disks, as well as the hardware and software adapters used by vSAN.

vSAN – Virtual Machine Consumption

This set of graphs provides a front-end view of all virtual machines on the host.

Graphs

  • IOPS – IOPS consumed by all vSAN client on the host, including virtual machines and stats objects
  • Throughput – throughput of all vSAN client on the host, including virtual machines and stats objects
  • Latency – latency of all vSAN client on the host, including virtual machines and stats objects
  • Local Client Cache Hit IOPS – Average local client cache read IOPS
  • Local Client Cache Hit Rate – Percentage of read IOs which could be satisfied by the local client cache
  • Congestions – Congestion of all vSAN client on the host, including virtual machines and stats objects
  • Outstanding IO – Outstanding IO for all vSAN client on the host, including virtual machines and stats objects

vSAN – Backend

This section provides a glimpse into the backend of the vSAN host.

Resync Metrics

The resync metrics include traffic/load created by operations initiated automatically, or by an administrator. These operations include changes in policy, the repair of objects, maintenance mode and/or related evacuations, and rebalance operations whether manually initiated or automatic. The metrics in the graphs also detail what was the cause of the resync operation, which can be helpful when trying to determine the impact of maintenance mode, and rebalance operations.

Graphs

  • IOPS – vSAN host Backend IOPS
  • Throughput – vSAN host Backend Throughput
  • Latency – vSAN host Backend Latency
  • Resync IOPS – IOPS consumed by resync operation
  • Resync Throughput – Throughput of resync operations
  • Resync Latency – Latency of resync operations
  • Congestions – vSAN host Backend Congestion
  • Outstanding IO – vSAN host Backend Outstanding IO

vSAN – Disk Group

This view enables an administrator to review read and write performance on the level of the individual disk group. If activity or latency is occurring on a disk group, vCenter will show you in this section.

Graphs

  • Frontend(Guest) IOPS – vSAN disk group (cache tier disk) front-end IOPS
  • Frontend(Guest) Throughput – vSAN disk group (cache tier disk) front-end Throughput
  • Frontend(Guest) Latency – vSAN disk group (cache tier disk) front-end Latency
  • Overhead IOPS – vSAN disk group (cache tier disk) overhead IOPS
  • Overhead IO Latency – vSAN disk group (cache tier disk) overhead latency
  • Read Cache Hit Rate – vSAN disk group (cache tier disk) read cache hit rate
  • Evictions– vSAN disk group (cache tier disk) evictions
  • Write Buffer Free Percentage– vSAN disk group (cache tier disk) write buffer free percentage
  • Capacity and Usage–vSAN disk group capacity and usage
  • Cache Disk de-stage rate – The throughput of the data de-staging from cache disk to capacity disk
  • Congestions – vSAN disk group congestion
  • Outstanding IO – The outstanding write IO of disk groups
  • Outstanding IO Size – The outstanding write IO size of disk groups
  • Delayed IO Percentage – Percentage of IOs which go through vSAN internal queues
  • Delayed IO Average Latency – The average latency of IOs which go through vSAN internal queues
  • Delayed IOPS – The IOPS of delayed IOs which go through vSAN internal queues
  • Delayed IO Throughput – The throughput of delayed IOs which go through vSAN internal queues
  • Resync IOPS – vSAN disk group level IOPS of resync traffic
  • Resync Throughput – vSAN disk group level throughput of resync traffic
  • Resync Latency – vSAN disk group level average latency of resync traffic

vSAN – Disk

This view enables an administrator to review read and write performance on the level of the individual disk, whether it is the cache disk, or the capacity disk.

Graphs

  • Physical/Firmware Layer IOPS – vSAN cache/capacity tier disk physical IOPS at the firmware level
  • Physical/Firmware Layer Throughput – vSAN cache/capacity tier physical throughput at the firmware level
  • Physical/Firmware Layer Latency – vSAN cache/capacity tier disk physical latency at the firmware level
  • vSAN Layer IOPS – Capacity tier disk vSAN layer IOPS
  • vSAN Layer Latency – Capacity Tier disk vSAN layer latency

vSAN – Physical Adapters

This view enables an administrator to review inbound and outbound performance on the level of the individual physical network adapter.

Graphs

  • pNIC Throughput – Physical NIC throughput
  • pNIC Packets Per Second – Physical NIC packets per seconds
  • pNIC Packets Loss Rate – Physical NIC packet loss

vSAN – Vmkernel Adapters

This view enables an administrator to review inbound and outbound performance on the level of the individual VMkernel adapter.

Graphs

  • vMKernal Network Adapter Throughput – Vmkernel write throughput
  • VMkernel Network Adapter Packets Per Second – Vmkernel packets per second
  • VMkernel Network Adapter Packets Loss Rate – Vmkernel packet loss

vSAN – Vmkernel Adapters Aggregation

This view enables an administrator to review the aggregated inbound and outbound performance on all VMkernel adapters in a host.

Graphs

  • vSAN Host Network I/O Throughput – Host throughput for all VMkernel network adapters enabled for vSAN traffic.
  • vSAN Host Packets Per Second – Host packets per second for all VMkernel network adapters enabled for vSAN traffic.
  • vSAN Host Packets Loss Rate – Host packet loss for all VMkernel network adapters enabled for vSAN traffic.

VM Level

These views provide insight into the front-end and back-end performance and utilization at the VM level.

vSAN – Virtual Machine Consumption

This section displays metrics of the individual VM.

Graphs

  • IOPS – VM IOPS
  • Throughput – VM Throughput
  • Latency – VM Latency
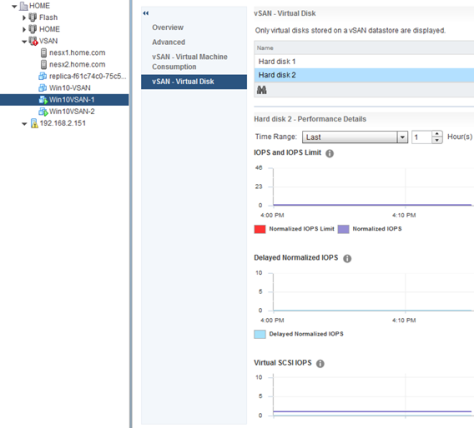
vSAN – Virtual Disk

This section shows metrics at the level of the virtual disk. The granularity of this level enables an administrator to look at the specific disk in question, at the VSCSI level of said disk.

Graphs

  • IOPS and IOPS Limits – normalized IOPS for a virtual disk. If an IOPS limit has been applied via policy, then the graph will also show the limit.
  • Delayed Normalized IOPS- Normailzed IOPS for the IOs that are delayed due to the application of the IOPS limit – this shows the impact of the limit.
  • Virtual SCSI IOPS – IOPS measured at the VSCSI layer for the individual disk
  • Virtual SCSI Throughput – Throughput measured at the VSCSI layer for the individual disk
  • Virtual SCSI Latency – Latency measured at the VSCSI layer for the individual disk

Alerting in an vSAN Environment

As with any storage environment, it is critical to receive a notification when any component in the environment is not functioning properly. This holds true in a vSAN environment. The Health Check plug-in for vCenter provides a comprehensive list of issues, which are useful when someone is looking in the vSphere Web Client, but does little own its own with regard to notification. Fortunately, VMware has included a myriad of alarms for vSAN that can be used to provide those reactive notifications. When triggered, these alarms will be visible in the vSphere Web Client, additional configuration will be required to ensure that a notification is sent. I typically configure email notification, which require vCenter to be configured with an SMTP server to use for sending said email. In most deployments, I recommend the following alarms be enabled for email notification. The list of alarms below are:

  • Disk Capacity

  • Overall Health Summary

  • Congestion

  • Disk Health

  • Network Health

  • Overall disks health

In the vSphere Web Client, right click on the vCenter object. Click the Monitor tab, and select Alarm Definitions

Search for the alarm name listed in the bullet points above

Click the Edit button

The alarm wizard begins

Click the Actions link on the right

Click the green Plus sign, and enter the email address that should receive the alerts.

Click Finish

Continue those steps for all VSAN alarms listed in bullet points at the top of the document.

Below is a comprehensive list of vSAN alarms available in vCenter.

Finding the right Lenovo Firmware for vSAN

With any new vSAN deployment, it is critical to ensure the drivers and firmware levels are in compliance with the VMware Compatibility Guide (VCG). Get to the VCG by following the steps below.

  1. Go to the VMware Compatibility Guide here
  2. Go to the vSAN section of the Compatibility Guide here
  3. Select Build Your Own based on Certified Components near the bottom

You’ll see the vSAN component selector. Even if you purchase a vSAN ready node, it is a good idea to reference this page to ensure that the firmware and driver that comes preinstalled on the system are what is supported by vSAN.

Our focus today is Lenovo firmware, specifically the ServeRAID 5210 SAS/SATA controller. Select I/O Controller in the Search For field and Lenovo in the Brand Name field, and enter 5210 in the click Update and View Results.

In this case, two 5210’s are listed. On the console of the host, run the following command (assuming your ServeRAID controller is vmhba0) to view the Vendor ID, Device ID, SubSystem Vendor ID, and Subsystem ID of the device.

In this case, the following value was returned, showing that a ServeRAID 5210 was installed and NOT a ServeRAID 5210e.

Upon clicking the link for the model, the below information is presented. This is where the fun begins.

The vSAN VCG shows that version 4.620.00-7178 should be installed. Upon checking the IMM of the Lenovo server, it was determined that the controller had a firmware version of 24.16.0-0104. Needless to say, the version installed does not line up with the version listed in the VCG.

Upon going to the Lenovo support site, and checking for controller firmware for the 5210, which was installed in a Lenovo 3650 M5 type 8871, the versions continued to be mismatched.

So, here’s the trick. Open up the Change History file. The change history file contains the mapping between the Lenovo firmware package name, and the MegaRAID firmware version. Below is a snipped of the change log. It seems that the MegaRAID firmware version is what is listed in the VCG. In this case, firmware version 4.620.00-7178 corresponds with Lenovo firmware package 24.12.0-0033.