NSX-T: Configuring SSL Cipher Suites

Many security organizations now require that TLS 1.1 be disabled on web servers. One area that gets overlooked are load balancers that are configured for SSL Offload or SSL Termination. One use case where I have customers using SSL termination on NSX-T native load balancing for web servers is where, in a one-arm configuration, the application owner has a requirement to see the client IP address in the logs. This is achieved by inserting the X-Forwarded-For header (XFF). In order to insert the XFF header, SSL must be terminated on the load balancer, thus a L7 virtual server is required. Below is a screenshot of where the Client SSL Profile is configured on the L7 Virtual Server. The screenshot shows the use of the default-balanced-client-ssl-profile.

In order to take a closer look at the SSL profiles on the NSX-T native load balancer, navigate to Load Balancing | Profiles and in Select Profile Type, choose SSL.

Open the arrow next to default-balanced-client-ssl-profile to view the SSL Ciphers and SSL Protocols supported by the profile. As we can see, TLS 1.1 is listed as supported.

Looking at default-high-security-client-ssl-profile we can see that the only supported SSL Protocol is TLS 1.2. Choosing the default-high-security-client-ssl-profile is the easiest to eliminate TLS 1.1.

In some cases, the security department will call out specific ciphers that they want to disallow. In that case, the best option is to create a custom Client SSL Profile. Creation is shown in the screenshot below.

First, select Custom under SSL Suite. Then, modify the SSL Suite removing TLS 1.1. Finally, remove any unnecessary SSL Ciphers. Click Save.

VMware’s vExpert Program: How it has helped me improve as an engineer

I was initially awarded the vExpert badge in 2016 on the partner path and have received the award every year since. What originally drew me to the program was recognition. I was heavily engaged in the VMTN community, and I wanted the vExpert badge next to my name. As my career evolved and I matured as an engineer, my use of the vast array of benefits associated with the vExpert program shifted as well. I eventually found one of the most valuable benefits to me was the licenses provided for my home lab. That is what I will be writing about today.

In an effort to develop my skillset with the ever-changing VMware product sets, I spent significant time and effort on certification. My approach to studying for certification typically begins with going through the exam blueprint. I like to ensure that I am able to implement in the UI each item listed in the blueprint. While using VMware’s Hands-on Labs (HOL) is nice, sometimes family or work obligations require me to pause and pick things up later. The HOLs eventually timeout, so it’s helpful to have a fully licensed home lab, and I have that thanks to the vExpert program. The licenses provided to me by the vExpert program have helped me achieve VCAP certification in the Data Center Virtualization, Network Virtualization, and End-User Computing verticals.

Having a fully licensed lab is also helpful in my role as a consultant. In many cases, I am tasked with upgrades and new product implementations. I have discovered over the years that it’s best to make as many decisions prior to execution as possible. This provides the opportunity to think through each decision, whether it’s an approach decision, selecting which radio button or checkboxes need to be checked, or IP allocation. Putting time into initial information gathering and doing dry runs of any upgrade task prepares for the production upgrade. Since most of my customers do not have a lab environment, having a fully licensed lab of my own enables me to do dry runs and have a full understanding of every step in the process so I’m well prepared to deliver a successful upgrade effort. This level of preparation has ensured smooth upgrades and product implementations.

I can speak to a recent example, where having a fully licensed home lab was helpful. I have a rather large customer using NSX-T native load balancing. With nearly a thousand VIPs configured in the environment across multiple load balancers, quite a load balancing features in use In preparation for a transition from native NSX-T load balancing to Avi Basic, some testing was necessary. First, I needed to get an Avi Controller deployed and transitioned to Basic licensing. Then, I needed to implement the same capabilities present on the native NSX-T load balancers on the Avi Basic controllers to confirm feature parity was in fact present. Finally, I needed to build out a Horizon environment to mimic the configuration that we expected to implement at the customer site using Avi. This would not have been possible without having a fully licensed home lab.

Along the same lines as upgrades and new product implementations, the lab has helped me perform feature testing. As we all know, many new releases contain new features. In order to ensure that the feature operates the way I expect it to operate, I like the implement the feature in a controlled environment prior to deploying in production. That controlled environment is my home lab. As new features become available, my customers expect me to provide them guidance around the use of the features. In many cases I do this by developing documentation, or more recently recording videos. I do this by way of my fully licensed home lab.

As you can see, just a single benefit of the vExpert program has helped me develop as an engineer and be a better consultant.

Updating to a specific version of VMware Tools

Introduction

Most administrators simply update their virtual machines with the version of VMware Tools that comes with the ESXi build. As of a few years ago, VMware bifurcated VMware Tools into multiple streams. The article detailing this can be read here. As a result, some versions of VMware Tools are release outside of the ESXi patch cycle. To make those releases available on hosts for installation on virtual machines (VMs), a new procedure needs to be used. The purpose of this document is to provide guidance on how to handle an update of VMware Tools on ESXi hosts. This guide is specific to version 6.x.

Process Summary

  1. Identify the VMware Tools Builds in the environment
  2. Confirm whether the version in place can be upgraded directly to the desired version
  3. Download the VMware Tools VIB for the version desired
  4. Upload VMware Tools Offline Bundle to Update Manager update store
  5. Create new update baseline in vCenter/Update Manager for new VMware Tools version
  6. Use baseline to push new VMware Tools version to ESXi hosts
  7. Use Update Manger to update VMware Tools to on VMs
  8. Validate the tools version is correct

Details and Scope of VMSA-2021-0013 & VMSA-2021-0011

Summarizing VMSA 2021-0013 and 2021-0011, all Windows VMs need VMware Tools updated to version 11.3.0 or later. There are other aspects to these VMSA, specifically VMRC and App Volumes, but they are out of scope for this document. VMs running Linux need not be addressed.

Mapping Build Number to Version

When viewing VMware Tools versions in vCenter, an administrator would typically look at the summary tab to view the version of an individual VM, as shown below.

Figure 1 – VMware Tools Build in Summary View

To view tools version in masse, select a cluster, click on VMs and ensure the VMware Tools Version Status field is listed.

Figure 2 – VMware Tools Build in Cluster View

In both cases, the VMware Tools build number shown is cryptic. Follow the link below to map build number to version

https://packages.vmware.com/tools/versions

Figure 3 – VMware Tools Build Number to Version Mapping

Determine Tools Upgradability

Once an inventory of the VMware Tools Versions exist, confirm the versions that are in place can be upgraded to the destination version. This can be done by viewing the VMware Product Interoperability Matrix – Upgrade Path here: https://interopmatrix.vmware.com/Upgrade?productId=139. In some cases, a multi-step upgrade may be necessary.

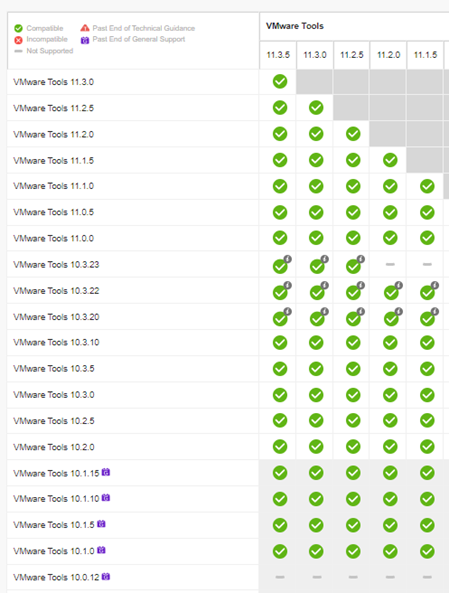
Figure 4 – VMware Tools Upgrade Path

Download VMware Tools

First, download

https://customerconnect.vmware.com/downloads/details?downloadGroup=VMTOOLS1130&productId=742

Figure 5 – VMware Tools Offline VIB Bundle Download

Create new update baseline in vCenter/Update Manager

One the VMware Tools Offline VIB Bundle has been downloaded, upload it to the Update Manager update repository. Navigate to Menu | Update Manager | Updates and choose Update From File.

Figure 6 – Upload Update to Repository from a File

Click Browse, select the zip file containing the VMware Tools Offline VIB Bundle and click Open. Then, click Import.

Figure 7 – Select the VMWare Tools Offline VIB Bundle

The bundle will begin importing. Observe and enjoy the progress.

Figure 8 – Import Progress of VMWare Tools Offline VIB Bundle

Once uploaded, create a new baseline in Update Manager. Go to Baselines, click New, and click Baseline.

Figure 9 – Create new Baseline for VMware Tools Offline VIB Bundle

The Create Baseline wizard begins. Enter the name of the Baseline, and select Patch as the content type. Click Next.

Figure 10 – Create Baseline Wizard – Step 1

Uncheck the box next to Automatically update this baseline with patches that match the following criteria, and click Next.

Figure 11 – Create Baseline Wizard – Step 2

Filter the patches based on the version of the VMware Tools Offline VIB Bundle that was uploaded, in this case 11.3.

Figure 12 – Create Baseline Wizard – Step 3 (filter)

Select the VMware Tools 11.3.0 Async Release. Be sure to validate the ESXi version to which the bundle applies before making the selection. Click Next.

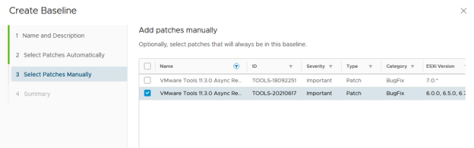
Figure 13 – Create Baseline Wizard – Step 3

Click Finish to create the baseline.

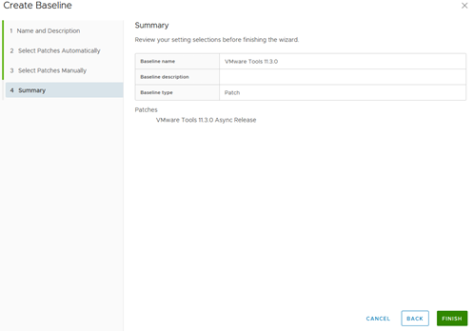
Figure 14 – Create Baseline Wizard – Step 4

Attach Update baseline

Next, choose the vCenter object to which the baseline should be applied. That might be a virtual datacenter, a cluster, or even just a host. Click on the vCenter object to which the baseline should be applied, navigate to Update and Host Updates. Click Attach and click Attach Baseline or Baseline Group.

Figure 15 – Attach Update Baseline

Select the VMware Tools Offline VIB Bundle baseline that was created in the previous step. Click Attach.

Figure 16 – Select Update Baseline to Attach

Remediate Hosts

In the same vCenter view, select the newly attached baseline containing the VMWare Tools Offline VIB Bundle, and click Remediate.

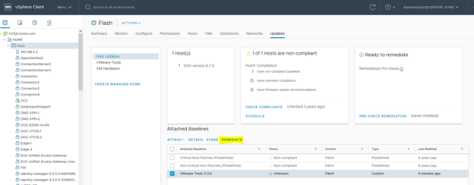
Figure 17 – Remediate Hosts with new Baseline

Select the ESXi hosts to remediate, and click Remediate. There are many options that can be chosen, but none apply in this case.

Figure 18 – Remediate Host Wizard

Update Virtual Machine Tools Version

Now that the VMware Tools version on the host has been updated, the next step is to update VMware Tools on the virtual machines. There are many different approaches to install VMware Tools on a virtual machine. This document mentions four (5) approaches and covers two (2) in detail – not an exhaustive list with excruciating detail.

  1. Update to Match Host on individual VM using Update Manager
  2. Update to Match Host on VM Folder using Update Manager
  3. Update to Match Host on Cluster using Update Manager (not covered here)
  4. Manually updating individual VMs in vCenter (not covered here)
  5. Manually running VMware Tools update on VM console (not covered here)

Approach 1 – Update to Match Host on individual VM

With the individual VM selected, go to the Updates view.

Figure 19 – Virtual Machine Tools Update

In the box titled VMware Tools, click Upgrade to Match Host.

Figure 20 – Virtual Machine Tools Update with Update Manager

Select the VM to be updated and review the options under settings.

Figure 21 – Upgrade VMware Tools to Match Host

Review the Scheduling Options to determine when to install VMware Tools on the VM.

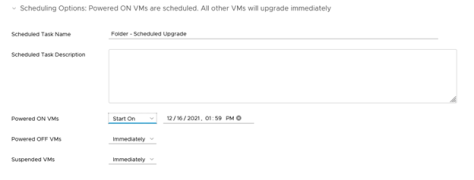
Figure 22 – Scheduling Options

Review the Rollback Options if there is a desire to provide simplified rollback for failed or problematic installations.

Figure 23 – Rollback Options

When all options are reviewed and confirmed, click Upgrade to Match Host

Figure 24 – Upgrade to Match Host

Approach 2 – Update to Match Host on VM Folder

Updates can be applied on the VM folder level. The process follows the same steps as referenced in Approach 1.

Figure 25 – Upgrade to Match Host: Folder containing VMs

Approach 3 – Update to Match Host on Cluster

Updates can be applied on the Cluster level. The process follows the same steps as referenced in Approach 1.

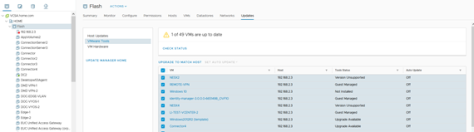
Figure 26 – Upgrade to Match Host: Cluster

Validation

Validation can be performed many ways. On a virtual machine, observe the Tasks view, and confirm a successful Initiated VMware Tools install or upgrade.

Figure 27 – Validation: Virtual Machine Tasks

The Summary view of a virutal machine also shows the VMware Tools build number.

Figure 28 – Validation: Virtual Machine Summary

Click on a VM Folder and the Updates tab – this shows whether the VMs in the selected folder are running a VMware Tools version that is Up to Date.

Figure 29 – Validation: VM Folder – Updates View

Click on a virtual datacenter, go to the VMs tab, and list the VMware Tools Version Status, which will show the build number.

Figure 30 – Validation: Virtual Datacenter – Virtual Machine Inventory

Click on a Cluster, go to the Updates tab – this shows whether the VMs in the selected cluster are running a VMware Tools version that is Up to Date.

Figure 31 – Validation: Cluster – Updates View


NSX-T 2.4 Released

NSX-T 2.4 is a big release for VMware.

VMware stated their Virtual Cloud Networking vision not long ago, with the goal to Connect & Protect any workload across any environment.

NSX-T has been providing Networking, Security, Automation, and Visibility across many platforms, as shown in the graphic below.


NSX-T 2.4 is focused on:

  • Want to take NSX everywhere for everyone
  • Simplicity is top of mind – make the solution easy to consume Day 0, 1, 2 Ops and beyond
    • whether you are an operator, user, or even if you are software (via API)
    • Reboot-less upgrades

NSX-T 2.4 What’s New

  • Policy Management
    • Revamped HTML5 UI
      • Day 0: Wizards and intuitive notifications
      • Day 1-2: contextual search, dashboards and visualizations
      • Day 2 and beyond: Upgrade tools with validation checks, Reboot-less upgrades
    • Declarative Policy API
  • Advanced Networking Services in the following areas
    • BGP enhancements
    • IPv6
    • VPN
    • ENS Support
  • Intrinsic Security
    • ID-based firewalling
    • FQDN/URL Whitelisting in DFW
    • L7 based application signatures for DFW
    • DFW Ops enhancements
  • Security Policy Integration
    • Guest Introspection
    • E-W Service Insertion
    • Partner Integrations are pending certifications
  • Various Cloud & Container updates
  • Platform Enhancements
    • Highly available Manager appliance
    • V2T Migration

More details shown below:

Important note: With NSX-T 2.4, NSX-T will be the lead platform for NSX. New deployments should be done with NSX-T.

NSX licenses are universal. Your NSX licenses entitle you to both NSX-T and NSX-v. If you have 12 sockets of NSX, you can deploy 6 sockets of NSX-v and 6 sockets of NSX-T.

NSX-v to NSX-T Migration

  • Coexistence – cluster managed by V and cluster managed by T
  • In-Place – Migrator is in the UI
  • Consolidation – leverage hardware refresh cycle


Persist Enterprise Mode Site List with VMware User Environment Manager


Problem Overview

Deployment requires the use of Enterprise Mode Site List with Microsoft Edge on Windows 10 in a linked clone environment running Windows 10. This setting is typically delivered via GPO.  The goal:  when a user opens Edge and attempts to navigate to a site, Windows automatically opens that site in IE 11 and close Edge. 


Behavior

When the user logs in, they are required to open Edge once to get the policy downloaded.  Once downloaded, the next time a user opens Edge with the URL in question, IE 11 opens the URL and closes Edge as expected, but this is required to occur once during every time the user logs into a new desktop, they must repeat these steps.  What they’d like to is have UEM persist the fact that Edge has received the policy and simply open the link in IE 11.  We are using UEM 9.2.1, with the Edge.ini file provided on the VMTN site. We are looking for assistance on how to persist the site list downloaded by the policy. 

Solution Overview

Edge stores the Enterprise Mode Site List information in <LocalAppData>\Micosoft\Windows\WebCache. This WebCache information is regularly in use by a scheduled task called Wininit\CacheTask which always keeps the files in use.


By simply adding <LocalAppData>\Micosoft\Windows\WebCache to the UEM config file, the FlexEngine.log file will show access denied errors when attempting to import the WebCache files. This is why the login tasks are necessary.


Three steps are required to ensure the Enterprise Mode Site List is made available to Edge immediately at logon. Those steps are below:


  • Modifications to the Edge.ini file used by UEM
  • Logon Task to cancel the CacheTask scheduled task before profile import
  • Logoff Task to begin the CacheTask scheduled task once profile import is complete


Solution Details

Below are detailed information for each step required to remedy the issue.


Step 1: Modifications to the Edge.INI file used by UEM


[IncludeFolderTrees]

<LocalAppData>\MicrosoftEdge

<LocalAppData>\Microsoft\Windows\WebCache


[IncludeRegistryTrees]

HKCU\SOFTWARE\Microsoft\MicrosoftEdge


Step 2: Create a Logon Task to stop the CacheTask process

The first logon task ends the Scheduled Task mentioned above using the SCHTASKS command and is set to run before the profile archive import – this unlocks the files in <LocalAppData>\Microsoft\Windows\WebCache in order to allow UEM to import the persisted data from the users’ profile.


Step 3: Create a Logoff Task to stop the CacheTask process

The second logon task runs the Schedule Task mentioned above using the SCHTASKS command and is set to run after the profile archive import – this reinitiates the CacheTask scheduled task.


Other Notes

There is one unknown to this solution. Given that the webcache file contains not only the Enterprise Mode Site List settings – it also contains Internet Explorer History, Cookies, Modern App cache, and more. As a result, the webcache will grow over time. This can consume a storage and could cause performance issue on logon time to copy the file back in. This solution may require the use of some mechanism to purge older cache data


This blog by James Rankin provided some insight on the scheduled tasks

http://www.htguk.com/ie10-and-ie11-cookies-and-history-persistence-in-roamingcitrix-situations-the-last-word/


Clear Cache via Command Line

https://stackoverflow.com/questions/12621969/clear-cache-of-browser-by-command-line


Creating a new UEM Persistence setting for User DSNs

  1. Launch User Environment Manager – Management Console


  1. Right-click Windows Settings and select Create Config File…


  1. Select Create a custom config file, and click Next


  1. Enter a name, for example User DSN, and click Next


  1. Add the text shown below.


  1. Navigate away from the node, and click Yes to save


  1. To validate:
  • login as a user
  • Create a user DSN
  • Log off
  1. Look in the user’s UEM profile archive folder to ensure it contains UserDSN.zip. A similar path is shown below:


Basic Deployment of NSX for Horizon

Solution Overview

This process includes an outline of the steps needed to deploy a micro-segmentation policy for VDI desktops using NSX for Horizon. The goal is to create a few groups of rules. These rule groups include the following:

  • ID-based Rules – Identity-based rules are used to allow access to applications. Multiple ID-based rules can be used to allow specific AD groups access to specific applications. These rules include access to system that would not be required when a user is not logged in.
  • Computer Rules – This rule set allows access from VDI desktops to talk to computer-level services, like domain controllers, KMS, Connection Servers, and DHCP. These services would need to be available to the system at startup.
  • Block Rules – These rules will block East-West traffic among the desktops to ensure desktops cannot communicate with one another; block all remaining traffic out of the desktop (and into the desktop if desired).
  • Client Access – This rule allows client endpoints the ability to access the desktop using display protocols and virtual channels for USB Redirection and Client Drive Redirection.

This solution assumes a kiosk setup. The desktops are configured to use local mandatory profiles. The solution does not include user profile persistence, nor does it leverage App Volumes.

Preliminary Steps

This preliminary section is required in order to ensure all components function properly and the components for all of the rules are created and available when it comes time to create the rules.

Deployment Assumptions

  • NSX Manager deployed and registered
  • VIBs deployed to hosts
  • Licenses allocated
  • Log Insight deployed and configured
  • Appropriate permissions assigned
  • vDS configured for all hosts

Create Exclusions

  • Create exclusion for vCenter

Prepare for ID Rules

  • Connect to domain – will need to create a specific service account
    • The domain account must have AD read permission for all objects in the domain tree. The event log reader account must have read permissions for security event logs – KB2122706
  • Create VDI User AD Group
  • Create Super User Group
  • Validate VMware Tools Versions
    • 10.0.8
    • KB 2139740
  • Deploy Guest Introspection
    • 1x IP address per host
    • Create IP Pool

Create Objects

Security Groups

  • Contains VDI Desktops
    • based on VM name or OS-type
  • Contains AD group
    • user accounts that will be used to login to desktops
  • Contains AD super users group (Domain Admins)

IP Sets

  • Network Address ranges that should be able to access VDI desktops
  • Proxy Server
  • DHCP Servers
  • DNS/Domain Controllers
  • Connection Server
  • KMS Server

Service Objects

  • Blast Extreme – 22443 TCP
  • Blast Extreme UDP – 22443 UDP
  • KMS – 1688
  • MMR – 9457
  • VMware-View6.x-JMS – 4002

Service Group Objects

  • Client Access
    • VMware-View-PCoIP
    • Horizon 6 PCoIP UDP traffic from View Agent to Client
    • VMware-View5.x-PCoIP-UDP
    • Blast Extreme
    • Blast Extreme UDP
    • Horizon 6 USB Access to desktops
    • MMR
    • RDP

Create Firewall Rules Desktops

This section describes how to use the newly created objects as well as pre-existing objects to create the various rule groups.

Group – Block E/W

Source

Service

Destination

Purpose

VDI Security Group

Any

VDI Security Group

Block E/W Traffic

Group – Grant Client Access

Source

Service

Destination

Purpose

Client Access IP Set

-Client Access (Group)

VDI Security Group

PCoIP

Blast Extreme

USB Redirection

MMR/CDR

RDP

Group – Permit User Applications

Source

Service

Destination

Purpose

Desktop User Secuirty Group

-HTTP

-HTPS

Proxy Server IP Set

Internet Access/Proxy

Super User Security Group

Any

Any

Super User – Unrestricted

Group – Permit Computer Applications

Source

Service

Destination

Purpose

VDI Security Group

-DHCP Server

-DHCP Client

DHCP Server IP Set

DHCP Relay

VDI Security Group

-Win 2008 – RPC, DCOM, EPM, DRSUAPI, NetLogonR, SamR, FRS

– Microsoft Active Directory (Group)

Domain Controller IP Set

Domain Authentication

VDI Security Group

-MKS

KMS Server IP Set

KMS

VDI Security Group

– VMware-View6.x-JMS

– VMware-View5.x-JMS

Connection Server IP Set

Connection Server Management of Desktop Agents

Connection Server IP Set

– Blast Extreme

VDI Security Group

HTML 5 Access

Block All – All traffic from VMs

Source

Service

Destination

Purpose

VDI Security Group

Any

Any

Block All other traffic

OR

Block All – All traffic to AND from VMs

Source

Service

Destination

Apply To

Purpose

Any

Any

Any

VDI Security Group

Block All other traffic

Wrap Up & Validation

  • Enable Logging on all rules
  • Enable flow monitoring – Validate

Validate

  • Log in to VDI desktop via HTML
  • Log in to VDI desktop via Client using PCoIP
  • Log in to VDI desktop via Client using Blast
  • Verify USB Redirection
  • Verify Connection Server reports desktops are reachable
  • Verify Internet is reachable
  • Verify other desktops are not reachable within a VDI desktop

Finding the right Lenovo Firmware for vSAN

With any new vSAN deployment, it is critical to ensure the drivers and firmware levels are in compliance with the VMware Compatibility Guide (VCG). Get to the VCG by following the steps below.

  1. Go to the VMware Compatibility Guide here
  2. Go to the vSAN section of the Compatibility Guide here
  3. Select Build Your Own based on Certified Components near the bottom

You’ll see the vSAN component selector. Even if you purchase a vSAN ready node, it is a good idea to reference this page to ensure that the firmware and driver that comes preinstalled on the system are what is supported by vSAN.

Our focus today is Lenovo firmware, specifically the ServeRAID 5210 SAS/SATA controller. Select I/O Controller in the Search For field and Lenovo in the Brand Name field, and enter 5210 in the click Update and View Results.

In this case, two 5210’s are listed. On the console of the host, run the following command (assuming your ServeRAID controller is vmhba0) to view the Vendor ID, Device ID, SubSystem Vendor ID, and Subsystem ID of the device.

In this case, the following value was returned, showing that a ServeRAID 5210 was installed and NOT a ServeRAID 5210e.

Upon clicking the link for the model, the below information is presented. This is where the fun begins.

The vSAN VCG shows that version 4.620.00-7178 should be installed. Upon checking the IMM of the Lenovo server, it was determined that the controller had a firmware version of 24.16.0-0104. Needless to say, the version installed does not line up with the version listed in the VCG.

Upon going to the Lenovo support site, and checking for controller firmware for the 5210, which was installed in a Lenovo 3650 M5 type 8871, the versions continued to be mismatched.

So, here’s the trick. Open up the Change History file. The change history file contains the mapping between the Lenovo firmware package name, and the MegaRAID firmware version. Below is a snipped of the change log. It seems that the MegaRAID firmware version is what is listed in the VCG. In this case, firmware version 4.620.00-7178 corresponds with Lenovo firmware package 24.12.0-0033.

Using VSAN Performance Graphs

This document details the use of the graphs provided by the vSAN performance service. The vSAN performance service provides end-to-end visibility into vSAN performance. With metrics accessible by the vSphere Web Client, it further enhances an administrators view into the vSAN storage environment.

Front-end vs Back-end

Many of the performance graphs refer to front-end and back-end. Virtual machines are considered front-end – where the application on the virtual machine reads and writes to disk, generating say 100 IOPS. Backend traffic refers to the underlying objects – where the same VM, configuring in a RAID-1 configuration, would generate that same 100 IOPS across both replicas, thus totaling 200 back-end IOPS.

Cluster Level

These views provide insight into the front-end and back-end performance and utilization at the cluster level.

vSAN – Virtual Machine consumption

This set of graphs provides a front-end view of all virtual machines in the cluster.

Graphs

  • IOPS – IOPS consumed by all vSAN client in the cluster, including virtual machines & stats objects
  • Throughput – Throughput of all vSAN client in the cluster, including virtual machines & stats objects
  • Latency – Average latency of IOs generated by all vSAN clients in the cluster, including virtual machines & stats objects
  • Congestion – Congestion of IOs generated by all vSAN clients in the cluster including virtual machines & stats objects
  • Outstanding IO – Outstanding IO from all vSAN clients in the cluster, including virtual machines & stats objects

vSAN – Backend

This section provides a glimpse into the backend of the vSAN cluster.

Graphs

  • IOPS – vSAN Cluster Backend IOPS
  • Throughput – vSAN Cluster Backend Throughput
  • Latency – vSAN Cluster Backend Latency
  • Congestion – vSAN Cluster Backend Congestion
  • Outstanding IO – vSAN Cluster Backend Outstanding IO

Host Level

Similar to the Cluster view, the host view provides insight into the front-end and back-end performance and utilization, except at the host level. Given that the ESXi host is the foundation building block of a vSAN cluster, these views provide insight into the indidual disk groups and disks, as well as the hardware and software adapters used by vSAN.

vSAN – Virtual Machine Consumption

This set of graphs provides a front-end view of all virtual machines on the host.

Graphs

  • IOPS – IOPS consumed by all vSAN client on the host, including virtual machines and stats objects
  • Throughput – throughput of all vSAN client on the host, including virtual machines and stats objects
  • Latency – latency of all vSAN client on the host, including virtual machines and stats objects
  • Local Client Cache Hit IOPS – Average local client cache read IOPS
  • Local Client Cache Hit Rate – Percentage of read IOs which could be satisfied by the local client cache
  • Congestions – Congestion of all vSAN client on the host, including virtual machines and stats objects
  • Outstanding IO – Outstanding IO for all vSAN client on the host, including virtual machines and stats objects

vSAN – Backend

This section provides a glimpse into the backend of the vSAN host.

Resync Metrics

The resync metrics include traffic/load created by operations initiated automatically, or by an administrator. These operations include changes in policy, the repair of objects, maintenance mode and/or related evacuations, and rebalance operations whether manually initiated or automatic. The metrics in the graphs also detail what was the cause of the resync operation, which can be helpful when trying to determine the impact of maintenance mode, and rebalance operations.

Graphs

  • IOPS – vSAN host Backend IOPS
  • Throughput – vSAN host Backend Throughput
  • Latency – vSAN host Backend Latency
  • Resync IOPS – IOPS consumed by resync operation
  • Resync Throughput – Throughput of resync operations
  • Resync Latency – Latency of resync operations
  • Congestions – vSAN host Backend Congestion
  • Outstanding IO – vSAN host Backend Outstanding IO

vSAN – Disk Group

This view enables an administrator to review read and write performance on the level of the individual disk group. If activity or latency is occurring on a disk group, vCenter will show you in this section.

Graphs

  • Frontend(Guest) IOPS – vSAN disk group (cache tier disk) front-end IOPS
  • Frontend(Guest) Throughput – vSAN disk group (cache tier disk) front-end Throughput
  • Frontend(Guest) Latency – vSAN disk group (cache tier disk) front-end Latency
  • Overhead IOPS – vSAN disk group (cache tier disk) overhead IOPS
  • Overhead IO Latency – vSAN disk group (cache tier disk) overhead latency
  • Read Cache Hit Rate – vSAN disk group (cache tier disk) read cache hit rate
  • Evictions– vSAN disk group (cache tier disk) evictions
  • Write Buffer Free Percentage– vSAN disk group (cache tier disk) write buffer free percentage
  • Capacity and Usage–vSAN disk group capacity and usage
  • Cache Disk de-stage rate – The throughput of the data de-staging from cache disk to capacity disk
  • Congestions – vSAN disk group congestion
  • Outstanding IO – The outstanding write IO of disk groups
  • Outstanding IO Size – The outstanding write IO size of disk groups
  • Delayed IO Percentage – Percentage of IOs which go through vSAN internal queues
  • Delayed IO Average Latency – The average latency of IOs which go through vSAN internal queues
  • Delayed IOPS – The IOPS of delayed IOs which go through vSAN internal queues
  • Delayed IO Throughput – The throughput of delayed IOs which go through vSAN internal queues
  • Resync IOPS – vSAN disk group level IOPS of resync traffic
  • Resync Throughput – vSAN disk group level throughput of resync traffic
  • Resync Latency – vSAN disk group level average latency of resync traffic

vSAN – Disk

This view enables an administrator to review read and write performance on the level of the individual disk, whether it is the cache disk, or the capacity disk.

Graphs

  • Physical/Firmware Layer IOPS – vSAN cache/capacity tier disk physical IOPS at the firmware level
  • Physical/Firmware Layer Throughput – vSAN cache/capacity tier physical throughput at the firmware level
  • Physical/Firmware Layer Latency – vSAN cache/capacity tier disk physical latency at the firmware level
  • vSAN Layer IOPS – Capacity tier disk vSAN layer IOPS
  • vSAN Layer Latency – Capacity Tier disk vSAN layer latency

vSAN – Physical Adapters

This view enables an administrator to review inbound and outbound performance on the level of the individual physical network adapter.

Graphs

  • pNIC Throughput – Physical NIC throughput
  • pNIC Packets Per Second – Physical NIC packets per seconds
  • pNIC Packets Loss Rate – Physical NIC packet loss

vSAN – Vmkernel Adapters

This view enables an administrator to review inbound and outbound performance on the level of the individual VMkernel adapter.

Graphs

  • vMKernal Network Adapter Throughput – Vmkernel write throughput
  • VMkernel Network Adapter Packets Per Second – Vmkernel packets per second
  • VMkernel Network Adapter Packets Loss Rate – Vmkernel packet loss

vSAN – Vmkernel Adapters Aggregation

This view enables an administrator to review the aggregated inbound and outbound performance on all VMkernel adapters in a host.

Graphs

  • vSAN Host Network I/O Throughput – Host throughput for all VMkernel network adapters enabled for vSAN traffic.
  • vSAN Host Packets Per Second – Host packets per second for all VMkernel network adapters enabled for vSAN traffic.
  • vSAN Host Packets Loss Rate – Host packet loss for all VMkernel network adapters enabled for vSAN traffic.

VM Level

These views provide insight into the front-end and back-end performance and utilization at the VM level.

vSAN – Virtual Machine Consumption

This section displays metrics of the individual VM.

Graphs

  • IOPS – VM IOPS
  • Throughput – VM Throughput
  • Latency – VM Latency

vSAN – Virtual Disk

This section shows metrics at the level of the virtual disk. The granularity of this level enables an administrator to look at the specific disk in question, at the VSCSI level of said disk.

Graphs

  • IOPS and IOPS Limits – normalized IOPS for a virtual disk. If an IOPS limit has been applied via policy, then the graph will also show the limit.
  • Delayed Normalized IOPS- Normailzed IOPS for the IOs that are delayed due to the application of the IOPS limit – this shows the impact of the limit.
  • Virtual SCSI IOPS – IOPS measured at the VSCSI layer for the individual disk
  • Virtual SCSI Throughput – Throughput measured at the VSCSI layer for the individual disk
  • Virtual SCSI Latency – Latency measured at the VSCSI layer for the individual disk

Alerting in an vSAN Environment

As with any storage environment, it is critical to receive a notification when any component in the environment is not functioning properly. This holds true in a vSAN environment. The Health Check plug-in for vCenter provides a comprehensive list of issues, which are useful when someone is looking in the vSphere Web Client, but does little own its own with regard to notification. Fortunately, VMware has included a myriad of alarms for vSAN that can be used to provide those reactive notifications. When triggered, these alarms will be visible in the vSphere Web Client, additional configuration will be required to ensure that a notification is sent. I typically configure email notification, which require vCenter to be configured with an SMTP server to use for sending said email. In most deployments, I recommend the following alarms be enabled for email notification. The list of alarms below are:

  • Disk Capacity

  • Overall Health Summary

  • Congestion

  • Disk Health

  • Network Health

  • Overall disks health

In the vSphere Web Client, right click on the vCenter object. Click the Monitor tab, and select Alarm Definitions

Search for the alarm name listed in the bullet points above

Click the Edit button

The alarm wizard begins

Click the Actions link on the right

Click the green Plus sign, and enter the email address that should receive the alerts.

Click Finish

Continue those steps for all VSAN alarms listed in bullet points at the top of the document.

Below is a comprehensive list of vSAN alarms available in vCenter.